One Year in a Net-Zero Ontario Home: A Month-by-Month Look at Life After the Retrofit
· 9 min read
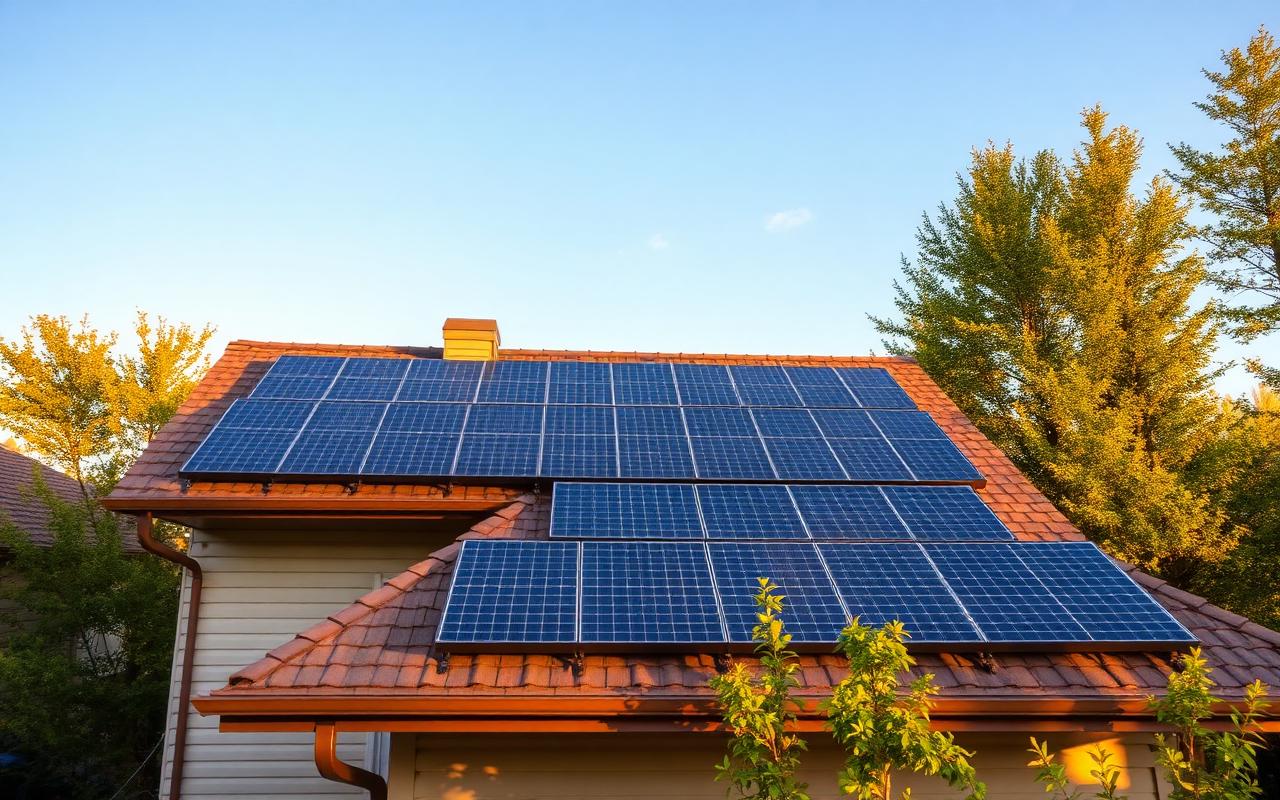
A representative first year after a solar-plus-heat-pump retrofit in Ontario — month by month through heating peaks, cold snaps, and peak solar production. Illustrative, not one customer's private bills.
For full program details and to apply, visit the official Home Renovation Savings™ program.
A note before we start: the year below is a representative, illustrative account built from the patterns we see across our Ontario solar-plus-heat-pump installations. It is not one specific customer's private utility data, and the month-to-month figures are approximate and meant to show the shape of the year rather than any one home's exact bills. Real numbers vary with house size, insulation, equipment sizing, occupancy, and your local utility's billing rules.
With that framing out of the way, here is what a typical first year looks like after a retrofit that paired a cold climate air source heat pump with a rooftop solar array and modest battery storage on an older Ontario home that had already been air-sealed and insulated.
If you'd like realistic numbers for your own home rather than this composite, Solify offers a free savings report that estimates the figures for your property.
January — peak heating demand. The heat pump runs nearly continuously through the deep cold, and it holds its own down to about -15°C before the backup element starts contributing. Solar production is at its annual low, so the home draws heavily from the grid. Story beat: the first real cold snap of the winter, and the thermostat never dips.
February — the ice storm test. A multi-day cold snap with ice accumulation knocked out a neighbour's older furnace, but the heat pump kept the house warm and the battery carried the essentials through a short outage. Production stays low and bills are the highest of the year, though far below what the old gas-and-resistance setup would have cost. Story beat: the grid blinks first, not the house.
March — the long shoulder. Days lengthen and solar production climbs noticeably, while heating demand eases. Bills drop sharply as the home begins covering more of its own load. Story beat: the first week where generation and demand cross over in the middle of the day.
April — shoulder season, best economics. Heating demand falls away while production keeps rising; the home exports surplus for the first time. This is the cheapest month of the year on net energy cost. Story beat: the meter spins backwards for the first time.
May — switching to cooling. The heat pump reverses for the first warm days, and the system proves it is genuinely two-way. Production is strong and consumption is low. Story beat: realizing the same hardware that heated the house now cools it.
June — long days, strong output. Solar production approaches its annual peak while cooling load is still modest. Net exports build the credit balance that will carry the home through the next winter. Story beat: the battery fills before lunch.
July — peak solar and peak cooling. Both production and air-conditioning demand hit their highs in the same weeks. The array covers the AC and still exports surplus; the battery shifts generation to cover evening cooling. Story beat: the hottest afternoon of the year, powered by sunlight collected that same day.
August — humid heat. Cooling runs hard through muggy nights and the heat pump's dehumidification becomes noticeable comfort, not just temperature. Production stays high. Story beat: sleeping through a humidex advisory with the windows closed.
September — the second shoulder. Cooling demand drops and production eases off its peak; the credit built over summer is at its fullest heading into fall. Story beat: the first cool morning where the system switches back to heating without anyone touching it.
October — heating resumes. The heat pump takes over again as nights cool, and production declines toward winter levels. The home starts drawing modestly from the grid again. Story beat: the credit balance begins its slow winter decline.
November — shorter, darker, colder. Production falls and heating demand rises; the home leans on the summer credit and modest grid draws. This is the second-most expensive month after February. Story beat: the first snow stays on the roof and the panels, and output dips.
December — the darkest month. Solar production is at its annual minimum and heating demand is high, so the home draws the most from the grid of any month. The summer credit absorbs most of it. Story beat: the solstice passes and every day after brings a little more light.
Stepping back, the full-year picture is what matters more than any single month. The home runs a seasonal deficit in winter and a surplus in summer, and over twelve months the two roughly balance — which is the whole point of net-zero. Heating cost is a fraction of the old gas system, cooling is essentially free in energy terms, and the biggest ongoing cost is the fixed delivery charge on the utility bill rather than the energy itself. The retrofit does not eliminate every bill, but it changes the shape of the year: expensive winters and cheap summers replace one flat, costly gas bill.
Two honest caveats. First, the credit you carry depends heavily on how your utility bills exported energy — net metering, net billing, and flat export rates produce very different year-end outcomes for the identical house and array. Second, a year like this assumes the envelope work was done first; a heat pump bolted onto a leaky, under-insulated home will cost more to run and produce less saving than the composite above.
If a year like this sounds worth exploring for your own home, the most useful next step is a site-specific estimate rather than more reading. Your actual roof, your actual utility, and your actual house set the real numbers.